Trends
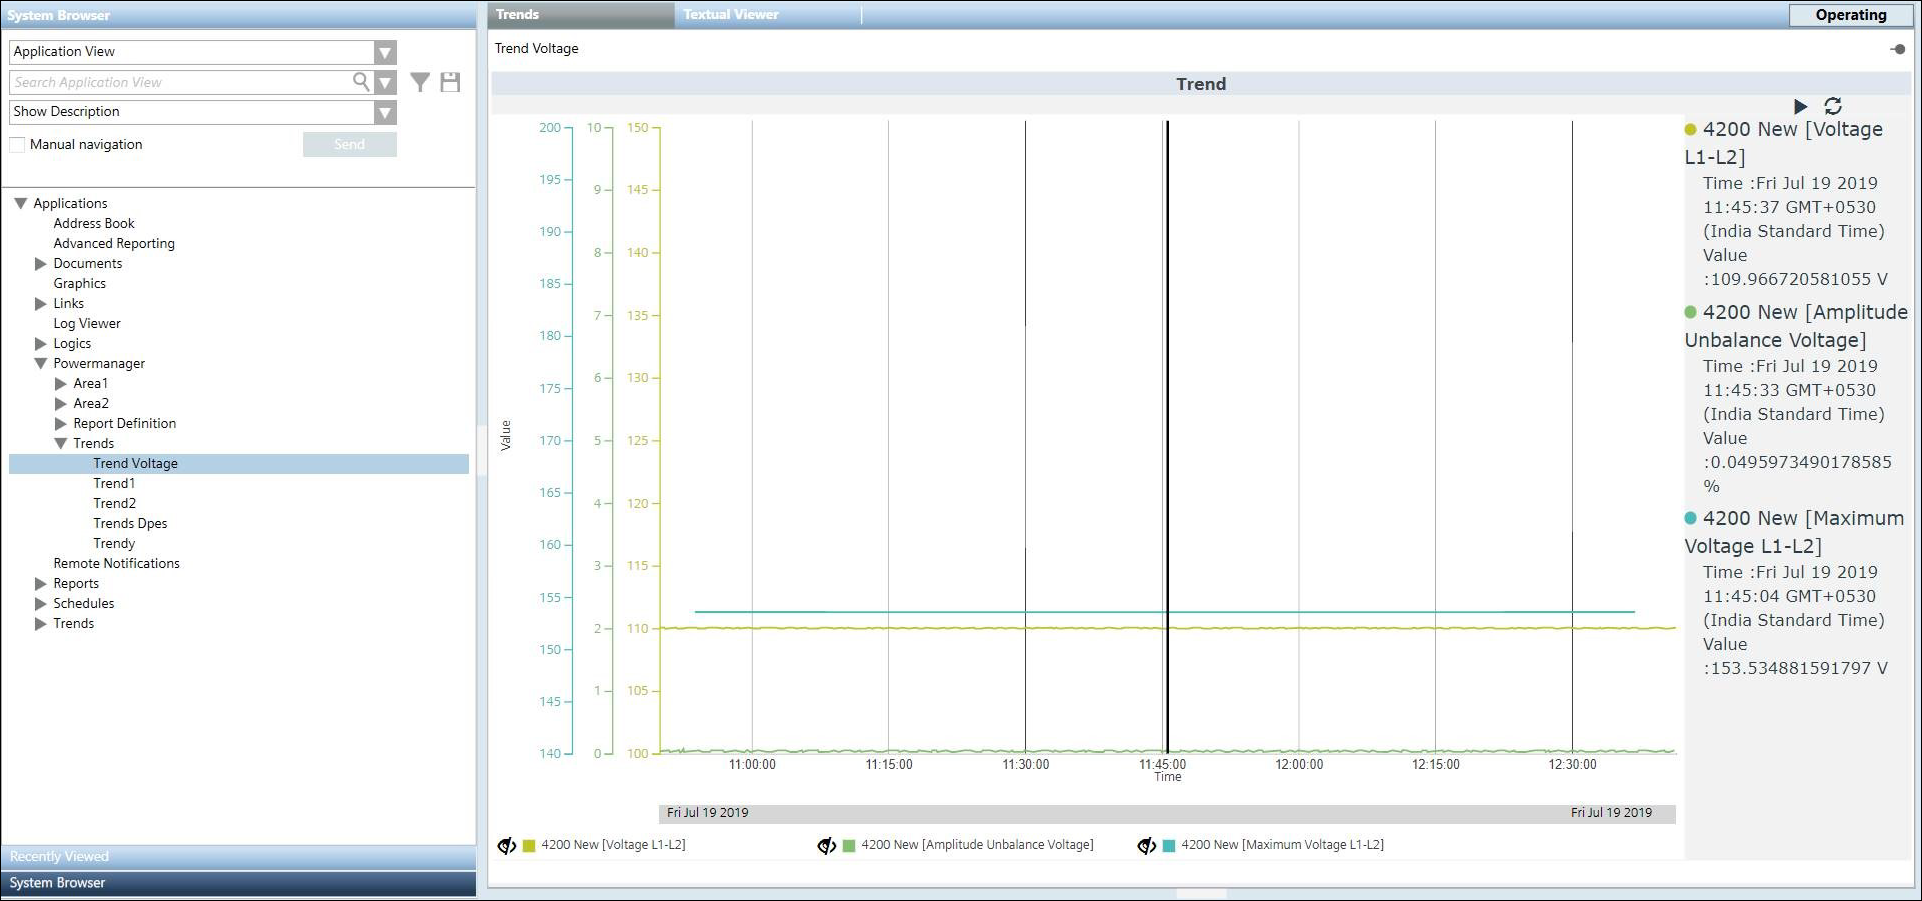
When you click the Trends node, it displays the trend series for the measurement points that are configured for the selected trend.
- It has options to start and stop the live trend when you click
 toggle icon.
 - It also has options to show or hide the data points associated with the trend when you click the
 toggle icon.
Additionally, you can zoom the data in the trend chart by hovering over the trend and scrolling.
You can also change time duration the trend using the range selector option at the bottom of the trend.