Report Workspace
In Operating mode, you can work with Powermanager reports using the Report Definition Configuration expander.
The following expanders help you in configuring the reports:
Main Expander
This expander displays the type of report selected.
Scheduling Report Configuration Expander
This expander allows you to configure the following parameters for scheduling a report.
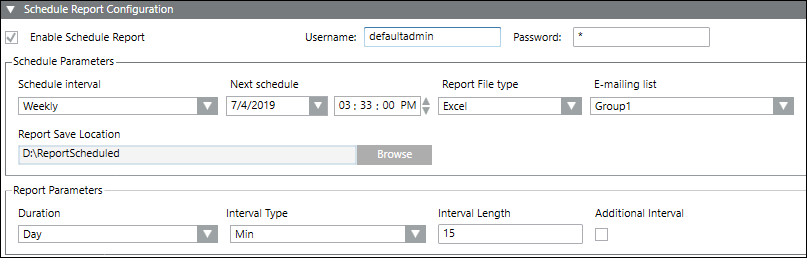
- Enable Schedule Report: Allows you to activate the configuration for routing the selected report to an email group or to a folder in the local memory.
- Username and Password: You have to enter the username and the password of the logged-in user to continue with the configurations.
- Schedule Interval: Allows you to select the interval for the routing of the report.
- Next schedule: Displays the date and time of the routing schedule. You can also select the scheduling date and time from this dropdown.
NOTE: In Source, if the measurement point with Consumption (1 day) is configured, then while scheduling report in the Scheduling Report Configuration section, the default scheduling time for the selected date will be 12:00:00 AM. This must be changed to 12:05:00 AM to get the complete report in the scheduled report for the selected duration. - Report File type: Allows you to select the format of the generated scheduled report. You can generate a report as either a PDF or EXCEL.
- E-mailing list: Allows you to select the email group to which the report will be routed.
- Report Save Location: Allows you to select the location of the folder in the local memory the report is routed to.
- Report Parameters: Allows you to configure the report parameters to be included in the scheduled report. The options include the following:
- Duration
- Interval Type
- Interval Length
- Additional Interval
- Chart Type
- Compare

NOTE:
The parameters in the Report Parameters section vary depending on the report type selected.
Source Expander
This expander allows you configure the following parameters of the report.
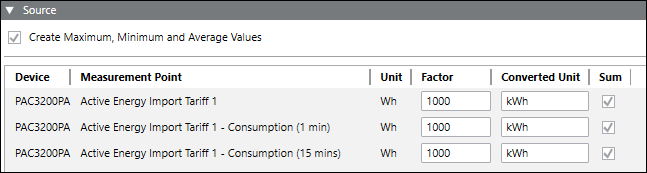
- Create Maximum, Minimum and Average Values: Select this checkbox to display the maximum, minimum and averages values in the generated report.
- Device: Allows you to add a device either by dragging-and dropping or by clicking New.
- Measurement Point: Allows you to configure the measurement points to be included in the report.
- Unit: Displays the unit of the selected measurement point.
- Factor: Allows you to enter the conversion factor for the selected measurement point.
- Converted Unit: Displays the unit of the measurement point after the conversion factor is applied.
- Sum: You can select the checkbox under this column to display the sum of the values.
- Weighing Factor: Allows you to set the weighing factor for the selected measurement point. The sum of the weighing factors for a measurement point is always one. If a weighing factor added for a measurement point is less than one, the difference of the weighing factor value is auto generated for the corresponding weighing factor.
Sankey Report: The toolbar in the Source expander of the Sankey report allows you to perform the following operations.
Toolbar Icon | Function |
| Allows you to copy the selected node within the Sankey tree |
| Allows you to paste the copied node within the Sankey tree |
| Allows you delete the selected node within the Sankey tree. |


NOTE:
You can add a maximum of 10 measurement points to a Power Peak report.