Trend Table Report
Trend Table Report
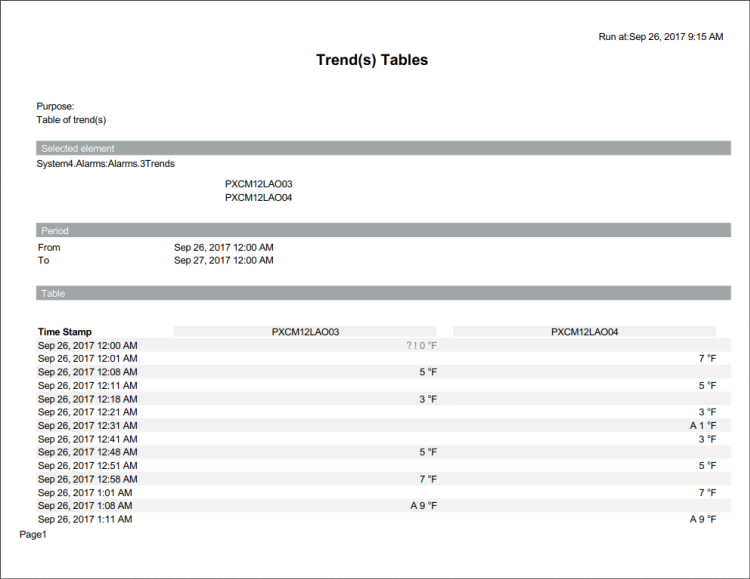
This report is designed to show values of multiple trended objects compared over a range of time.
Sample report
Legend
Indicator | Description for Table | Description for Graphic |
! | Bad value | Bad value |
Arrow Up – Red | Over high limit | Pass high limit or return from low limit |
Arrow Down – Blue | Below low limit | Return from or pass low limit |
Pencil | Manual correction | Manual correction |
? | Fault | Not applicable |
A | Alarm | Not applicable |
OfS | Out of Service | Not applicable |