Report Types
There are eight basic report types available from the standard library. Brief descriptions of each, along with their data requirements, are provided below.
Both the appearance and the functionality of each report can be further customized within Power BI according to the user’s needs.
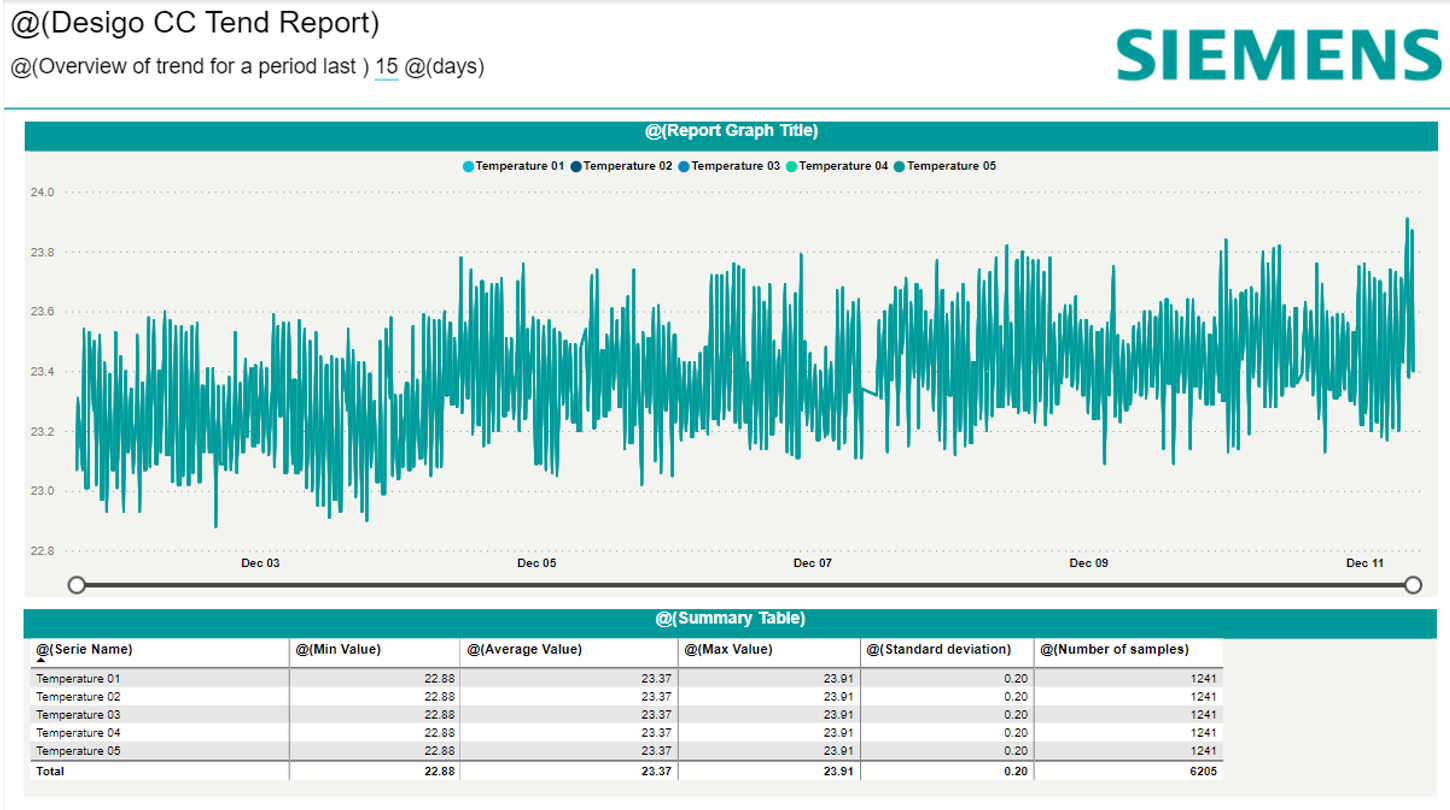
Trend Value Over Time
This template can be used to display any trend value that changes over time. The selected values are displayed in a line graph for the selected time period. Up to five trends can be included in one report. A table shows summary statistics within each trend: minimum and maximum value, average, standard deviation, and the number of samples included. Note that different types of trend values (for example, temperature and humidity) can be displayed on the same chart, but this may make it difficult to interpret the chart’s scale.
Template Name
Template_5_Trends
Default Values
Time Period | 60 days |
Fields
Table Name | Data Type |
Temperature 01 [Trend] | Trend object (online or offline) |
Temperature 02 [Trend] | Trend object (online or offline) |
Temperature 03 [Trend] | Trend object (online or offline) |
Temperature 04 [Trend] | Trend object (online or offline) |
Temperature 05 [Trend] | Trend object (online or offline) |
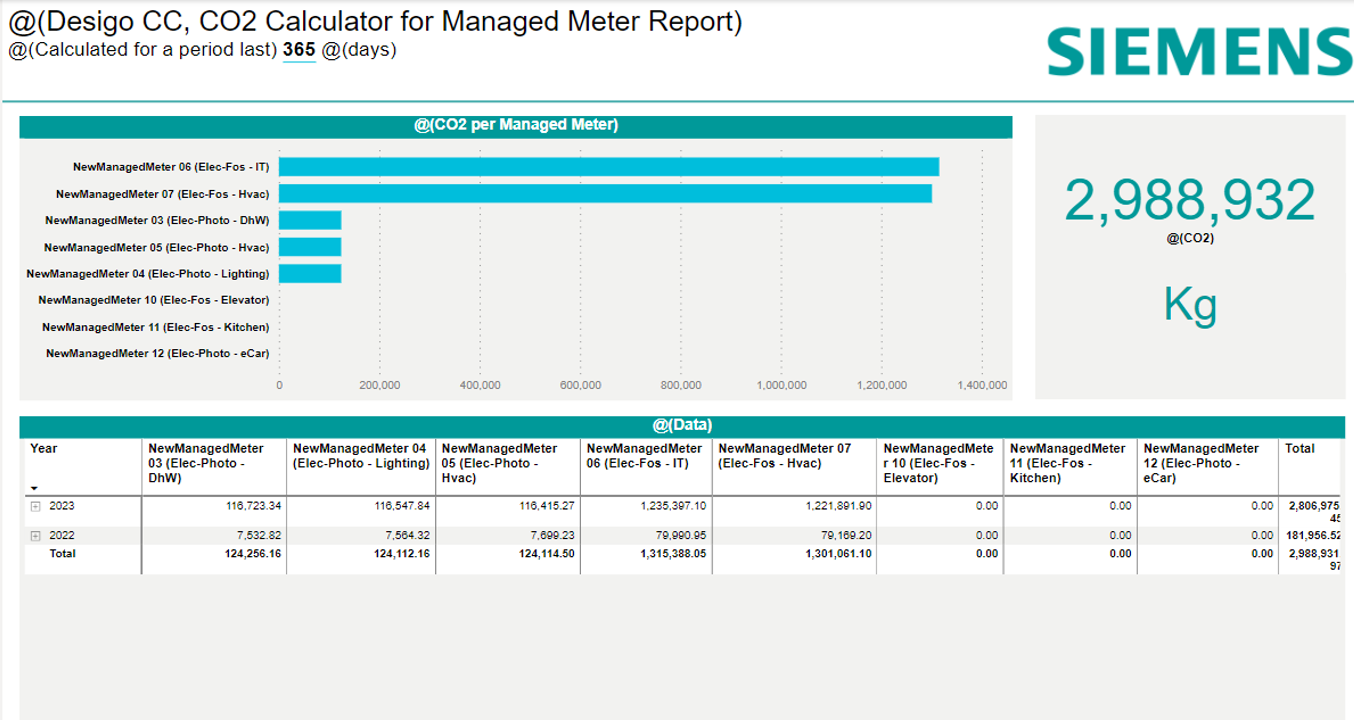
CO2 Production for a Group of Managed Meters
This report shows the CO2 emissions for a group of managed meters over a defined period of time. In addition to a data table with the measured values reported by your managed meter(s), a second configuration table gets the required energy conversion factors to calculate CO2(“fossil fuel”) emission equivalents for various energy sources (for example, oil, coal, solar). Note that within the Desigo CC managed meter interface, an energy source is referred to as a “media group.”
Template Name
Template_CO2_Calculation
Default Values
Time Period | 365 days |
Fields
Table Name | Data Type |
Managed Meter Consumption [ManagedMeters] | Path (Path can be D&D to filter Managed Meters) |
Managed Meter Config [ManagedMetersConfig] | Path (Path can be D&D to filter Managed Meters) |
Trend for a Single Managed Meter
This report charts the consumption values for a single managed meter over several equivalent time periods: for example, energy consumption in kilowatt-hours for the current year so far, for the previous year, and for two years ago. The time periods can be adjusted to other increments like the month or the day.
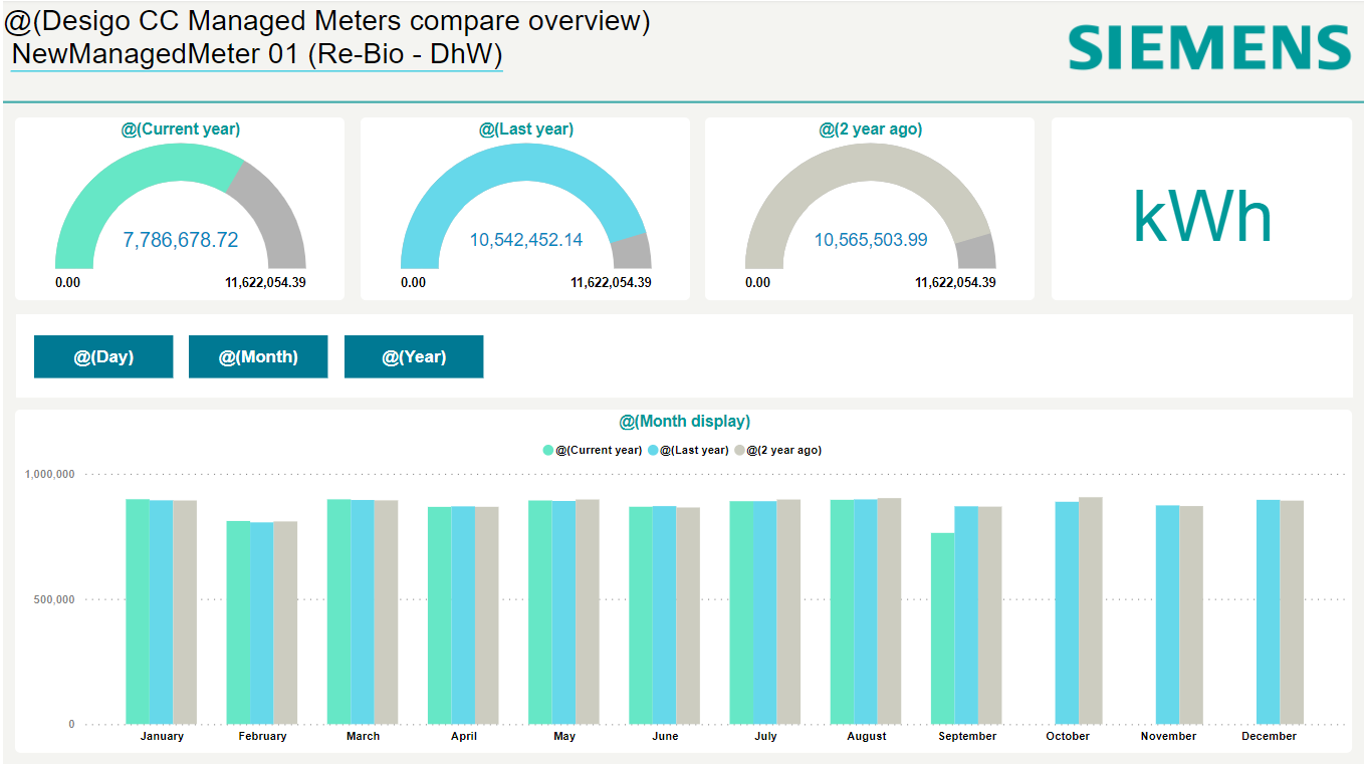
Light Version
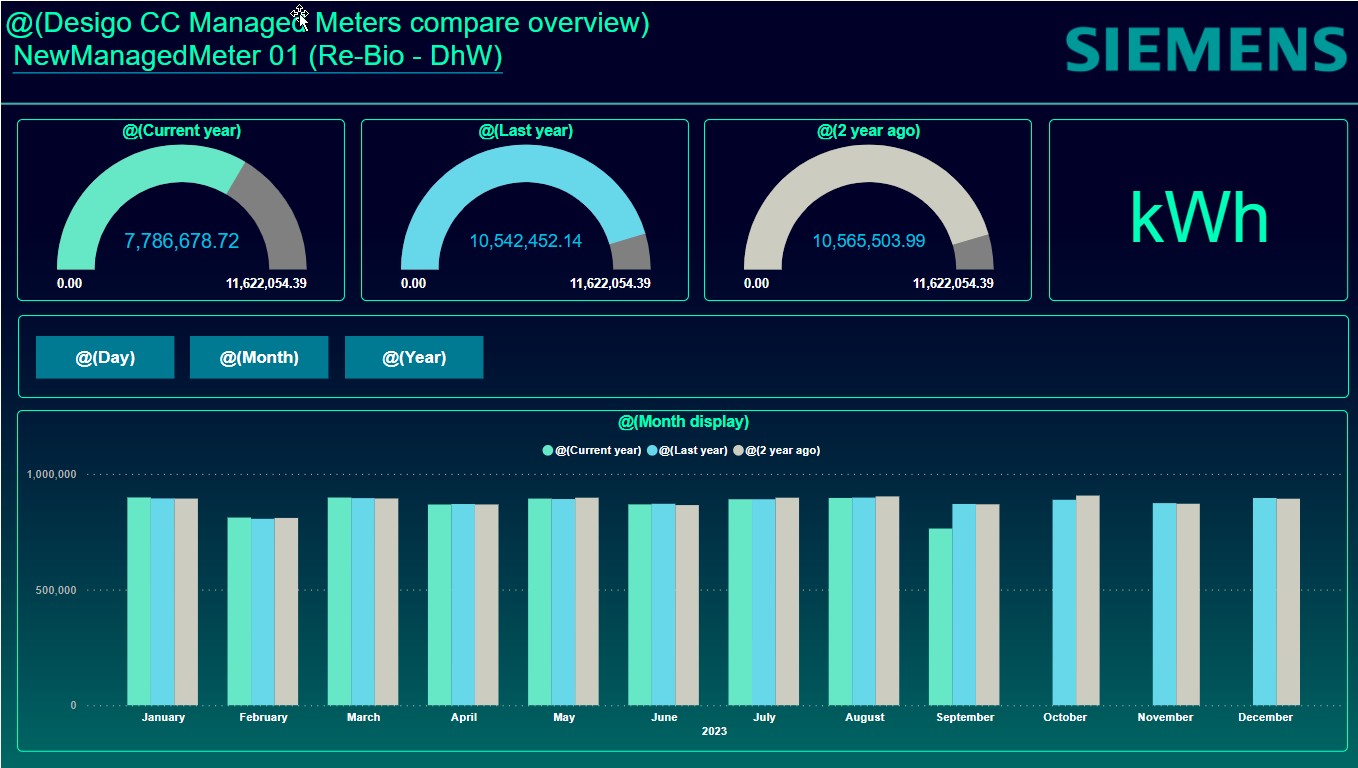
Dark Version
Template Name
Template_Dashboard_Managed_Meters_Compare
Default Values
Time Period | 1200 days |
Fields
Table Name | Data Type |
Managed Meter Consumption [ManagedMeters] | Path (Path can be D&D to filter Managed Meters) |
Managed Meter Config [ManagedMetersConfig] | Path (Path can be D&D to filter Managed Meters) |
Degree Days
This report shows the degree days (heating or cooling) over a defined period of time. Each report contains a user-defined reference value (e.g., “HDD reference value”) for both heating and cooling. For heating, a day with an outside air reference temperature below the HDD reference value requires heating. For cooling, any outside air value above the CDD reference value requires cooling. A chart shows the value of each heating and cooling degree day over time, according to its difference from the outside air reference value.
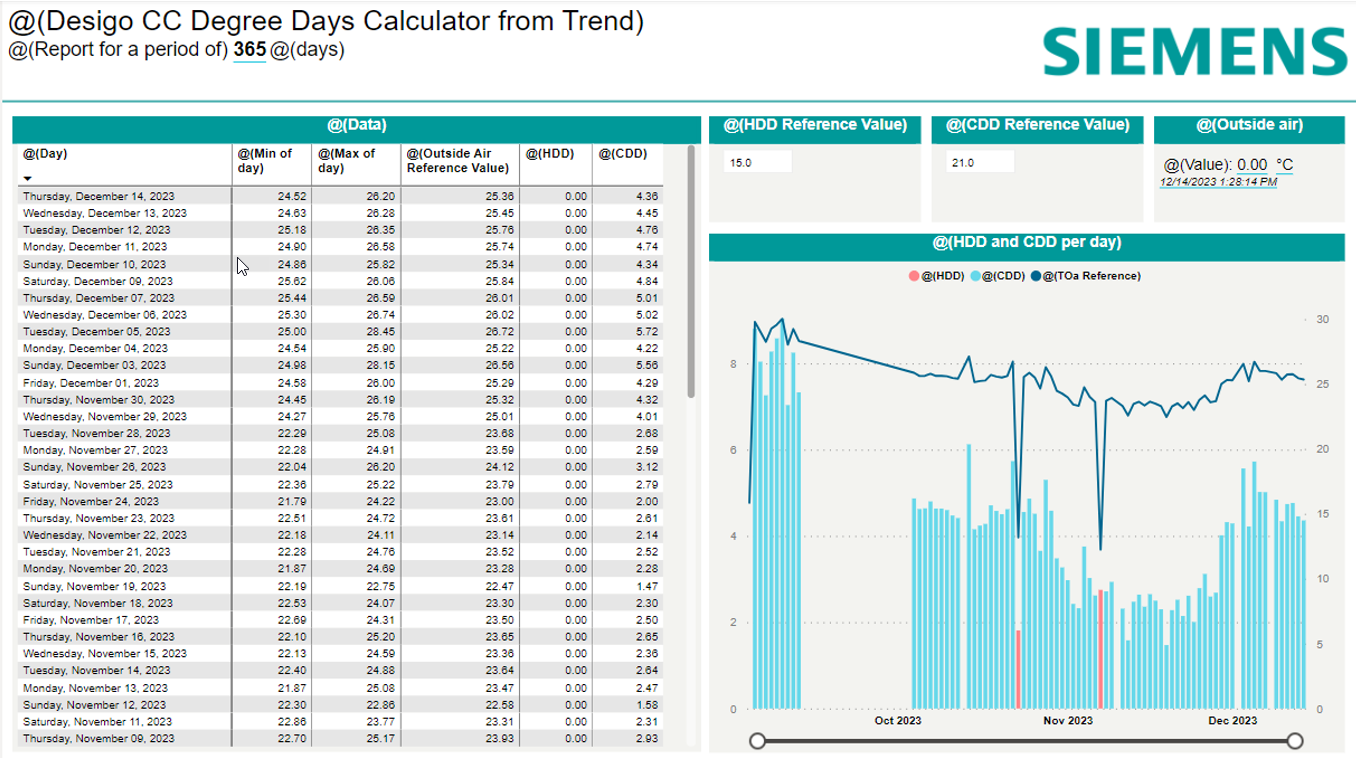
Degree Days
Template Name
Template_Degree_Days_Calculator
Default Values
Time Period | 60 days |
Fields
Table Name | Data Type |
OutsideAirTemperature [Trend] | Trend object (online or offline) + Description |
OutsideAirTemperature [Datapoint] | Datapoint |
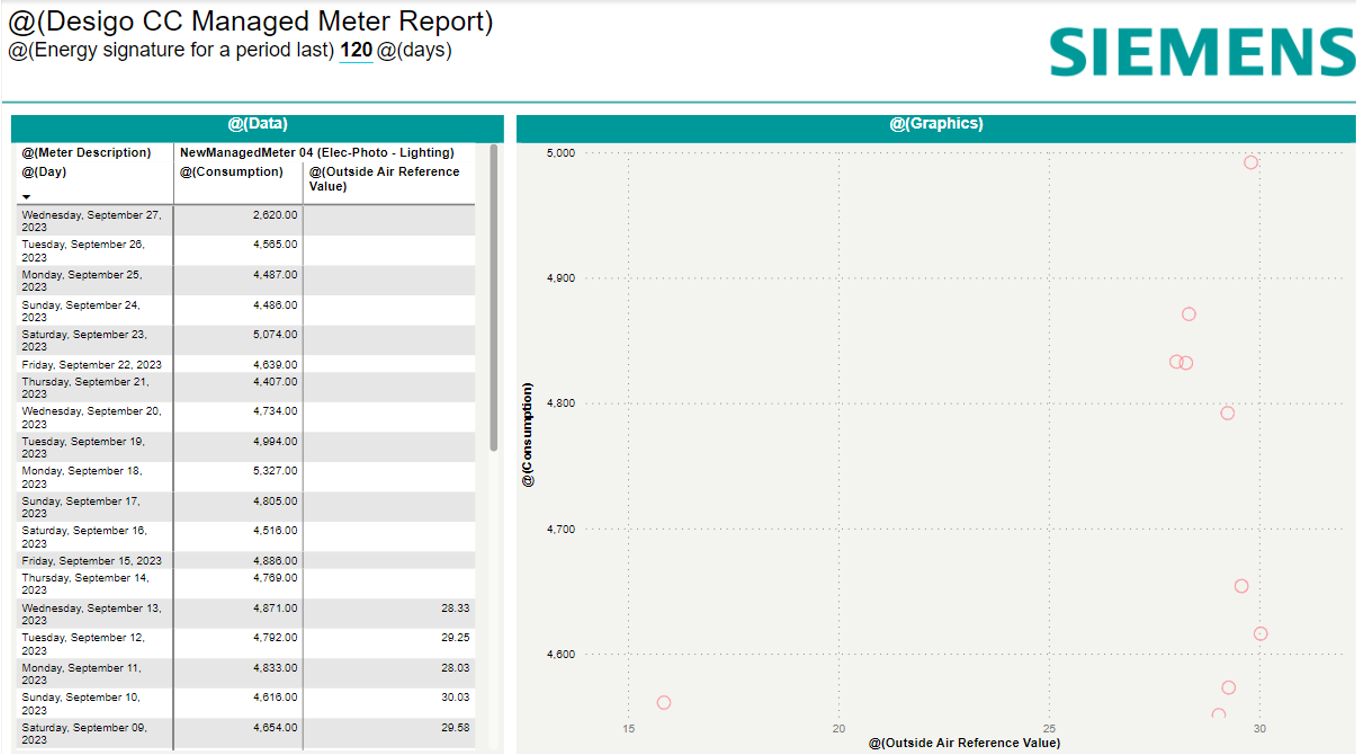
Energy Signature
This report uses a scatterplot to compare the outside reference air temperature for a single day to the energy consumption measured by a single managed meter on that same day. This helps your audience visualize how a change in air temperature causes a corresponding change in energy usage.
Template Name
Template_Energy_Signature
Default Values
Time Period | 60 days |
Fields
Table Name | Data Type |
OutsideAirTemperature [Trend] | Trend object (online or offline) + Description |
Managed Meter Consumption [ManagedMeters] | Path (Path can be D&D to filter Managed Meters) |
Managed Meter Config [ManagedMetersConfig] | Path (Path can be D&D to filter Managed Meters) |
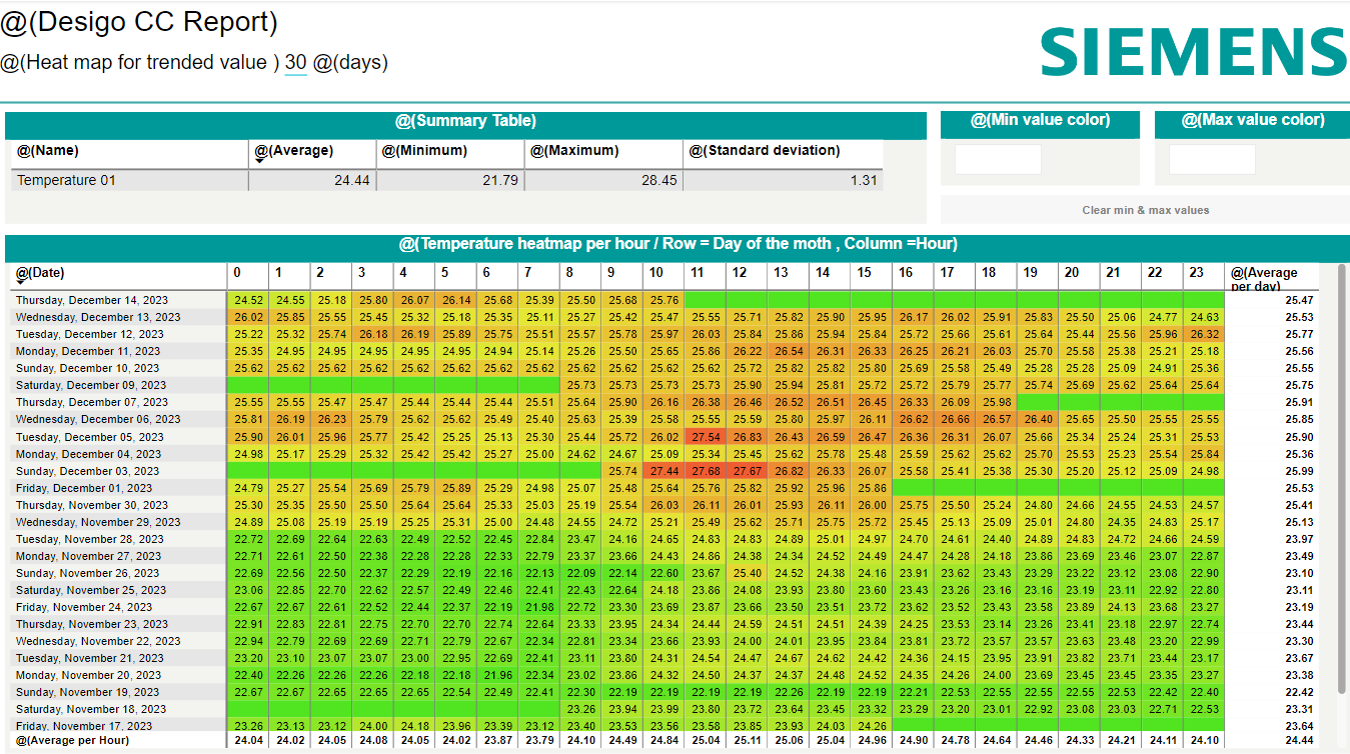
Heatmap Overview
This report displays a grid-based heatmap for a single trend value. Each cell shows the average temperature for the hour with color coding. Green is a normal value, yellow and orange are intermediate, with the highest values represented by red. The thresholds for each color are adjustable by the user.
Template Name
Template_Heatmap_Overview
Default Values
Time Period | 60 days |
Fields
Table Name | Data Type |
Temperature 01[Trend] | Trend object (online or offline) + Description |
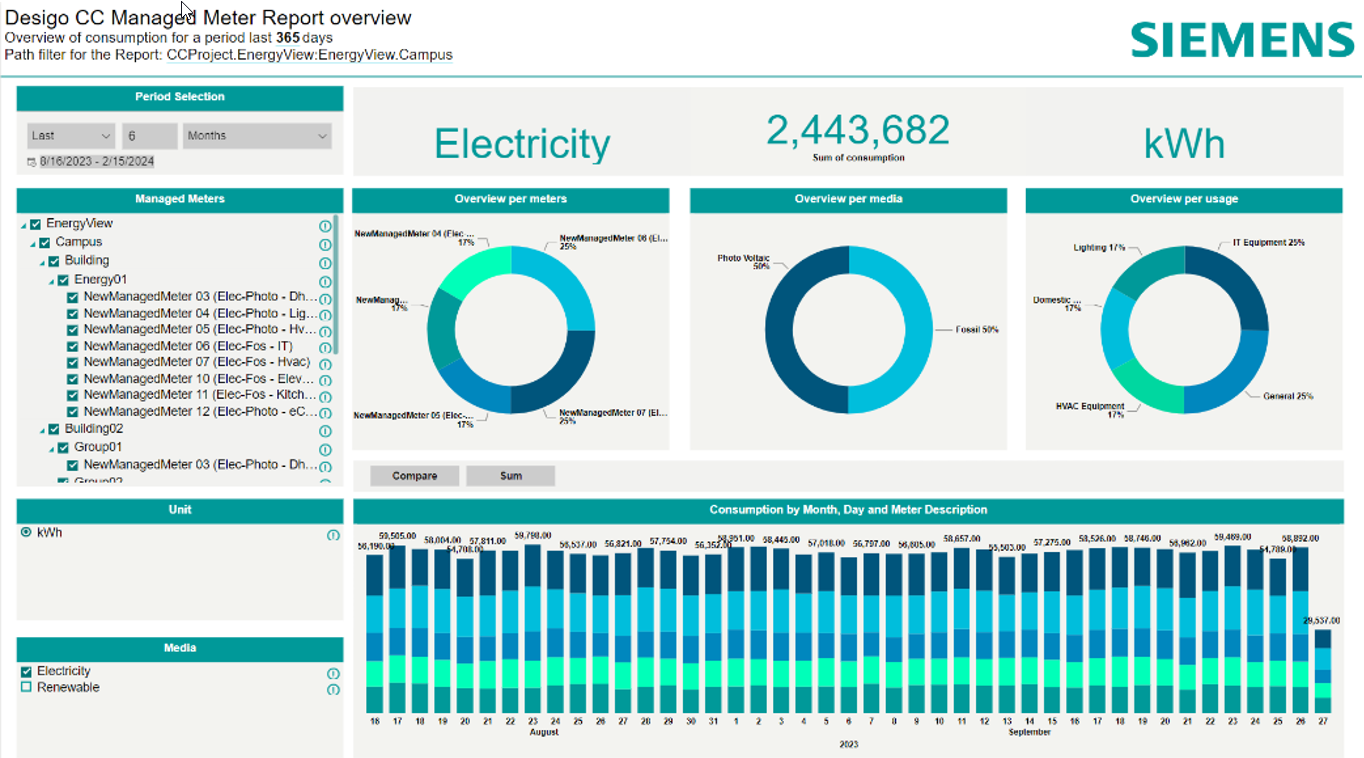
Overview of a Managed Meter Group
This report represents the energy consumption for a group of managed meters. In order for the values to display correctly, all managed meters must have the same media type (for example, “solar”) and the same units. There is also a tree-based menu that allows the user to display a subset of all managed meters.
Template Name
Template_Managed_Meters_Overview
Default Values
Time Period | 365 days |
Fields
Table Name | Data Type |
Managed Meters Historized [ManagedMeter] | Path (Path can be D&D to filter Managed Meters) |
Managed Meter Consumption [ManagedMeters] | Path (Path can be D&D to filter Managed Meters) |
Managed Meter Config [ManagedMetersConfig] | Path (Path can be D&D to filter Managed Meters) |
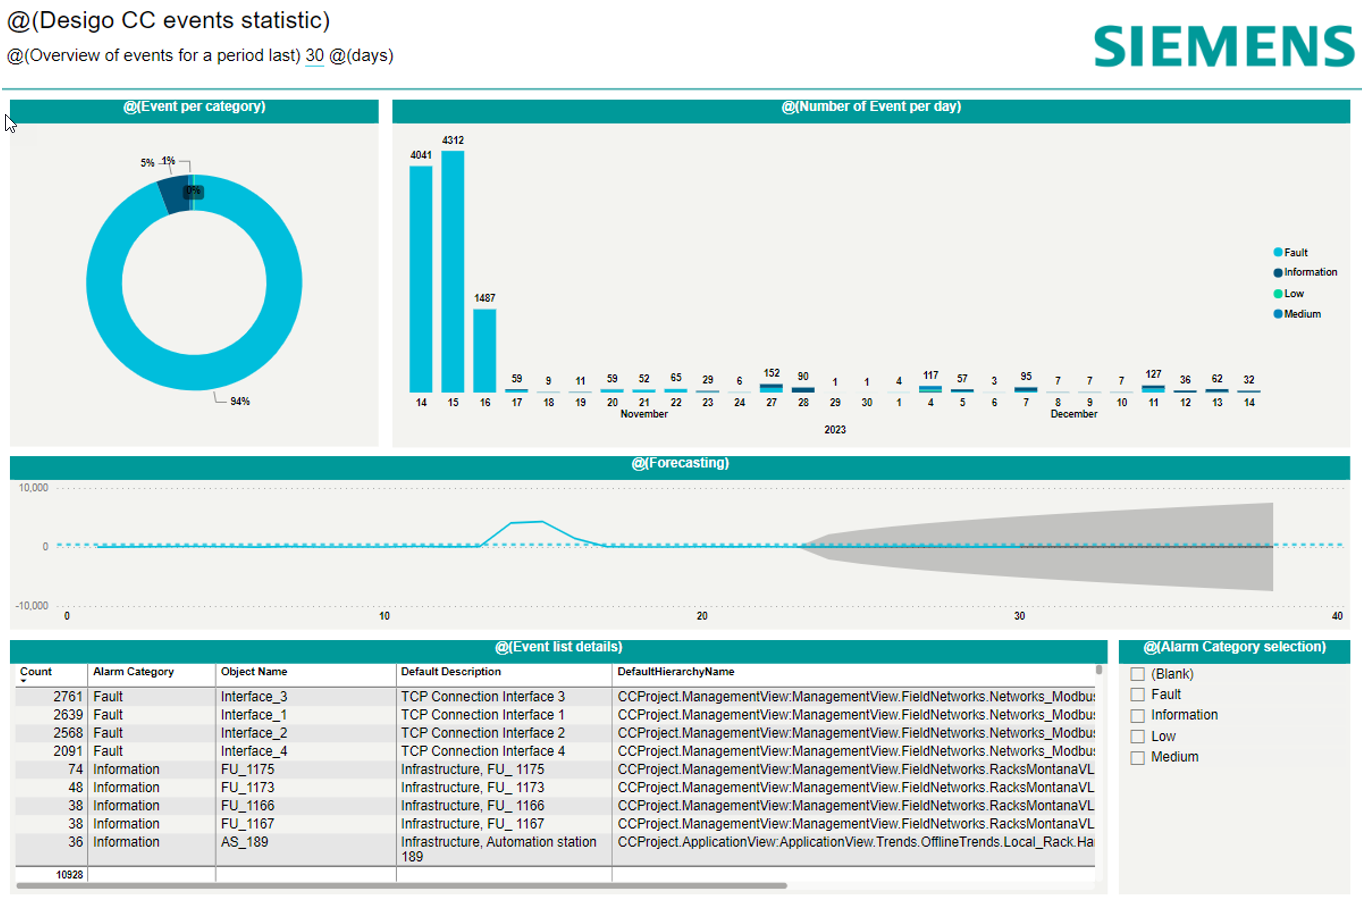
Log and Event Statistics
This report displays an overview of specific log events by day, including a graphical representation of log events by type and a table with more detailed information about each event.
Template Name
Template_Log_and_Event_Statistic
Default Values
Time Period | 60 days |
Fields
Table Name | Data Type |
Event Log Table [EventLogTable] | Path (Path can be D&D to filter) |
Log View Table [LogViewTable] | Path (Path can be D&D to filter) |